The Qt Graphs module provides a way to develop rapidly responding, complex, and dynamic 2D graphs for analytically demanding industries such as academic research and medicine. Qt Graphs provides 2D bars, lines, and scatter graphs. Combining user interaction and real-time 2D drawing graphs enables the creation of user interfaces that use space effectively.
见 AreaSeries , BarSeries , LineSeries , PieSeries , ScatterSeries ,和 SplineSeries 了解细节。
The Qt Graphs module provides the following 2D graph types:
GraphsView is the base container for all 2D graph types, into which graphs are added as series.
The data is drawn as an area composed by points. The points are defined by two series: upper and lower .
The area between the series is drawn as a graph. If only the upper series is defined, the area is then between the bottom of the graph and the upper series.
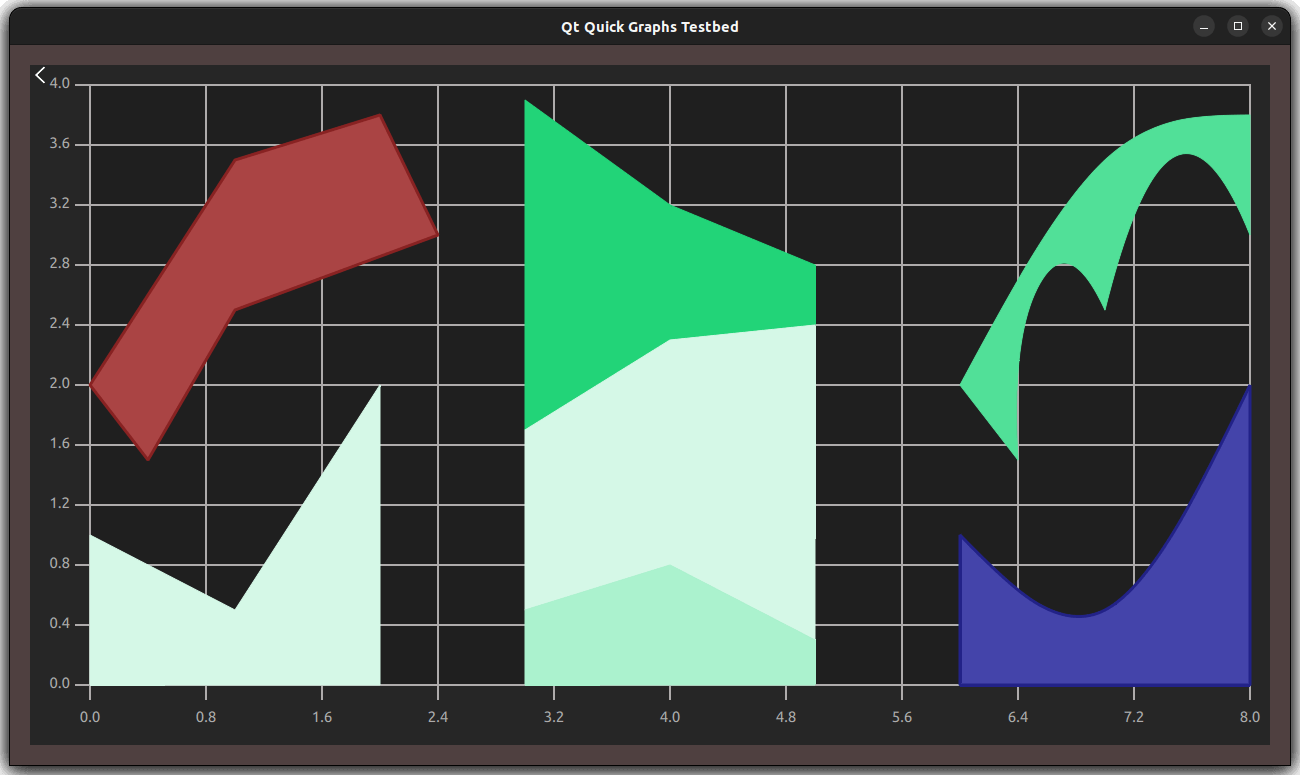
见 AreaSeries and XYPoint 了解更多信息。
The data is drawn as a series of vertical bars grouped by category, with one bar per category from each bar set added to the series.
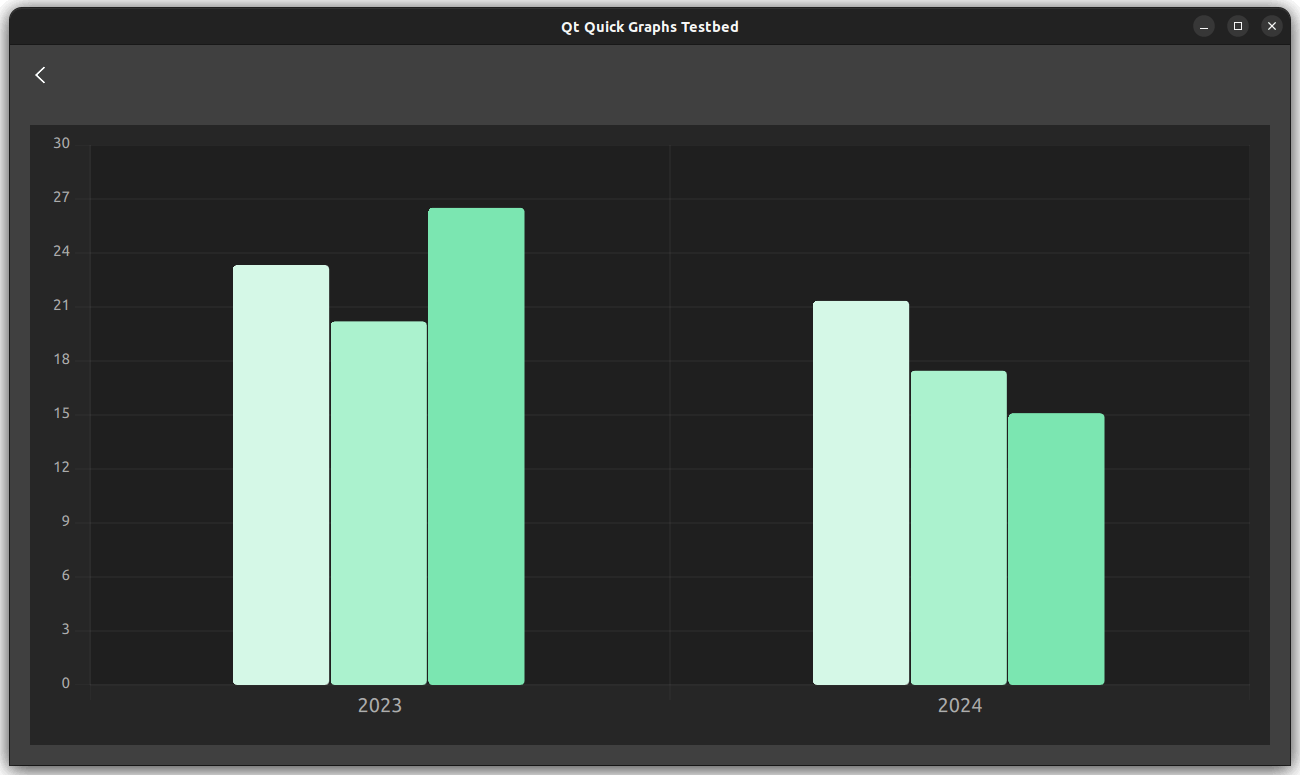
见 BarSeries and BarSet 了解更多信息。
A donut graph is a special case of a Pie graph , with an additional property for defining the hole size .
见 PieSeries and PieSlice 了解更多信息。
A line graph is used to show information as a series of data points connected by straight lines. For each point, two values are specified that determine its position on the horizontal axis and the vertical axis.
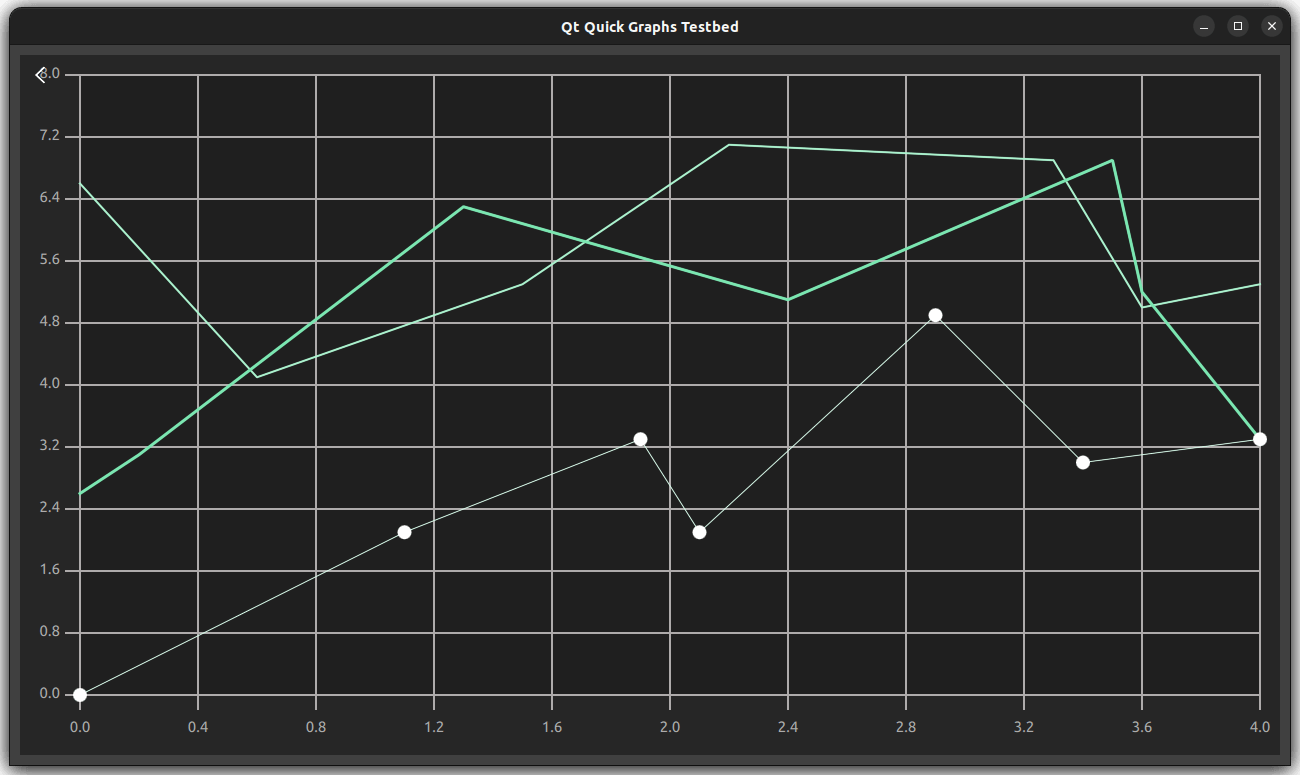
见 LineSeries and XYPoint 了解更多信息。
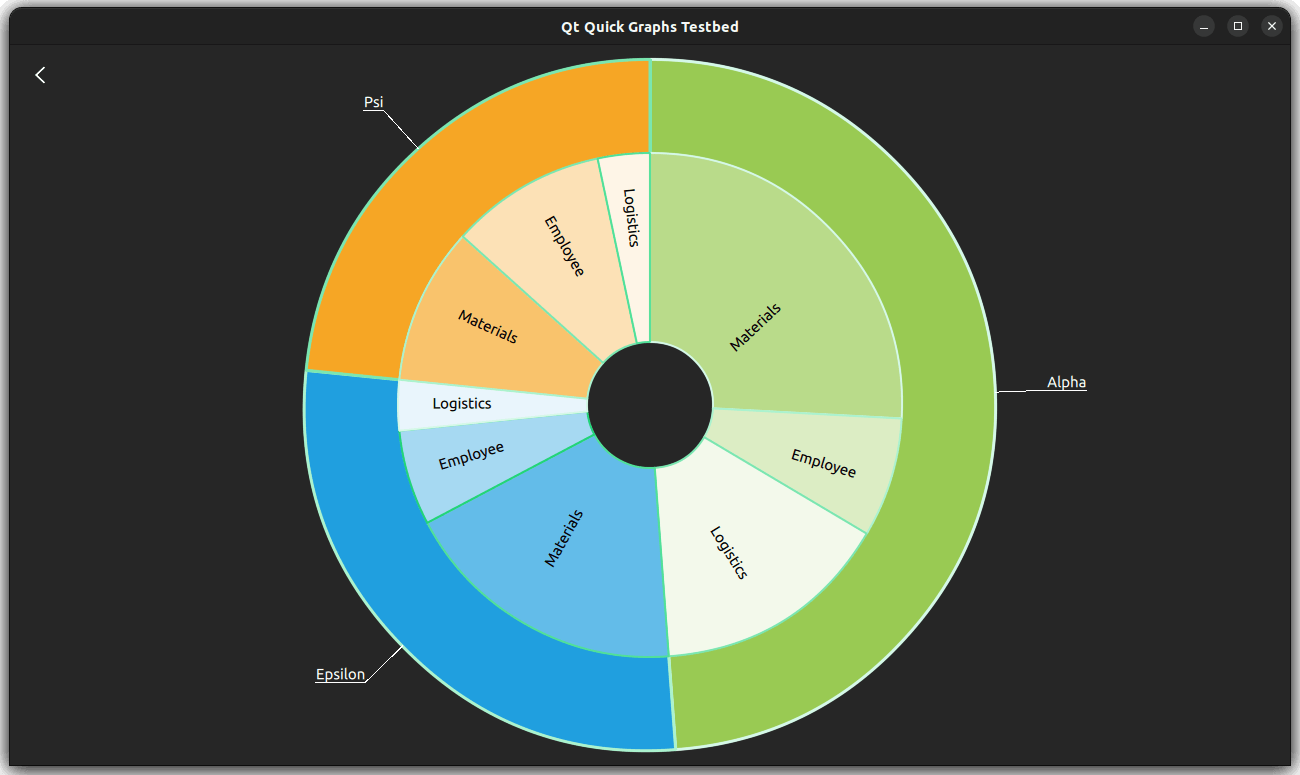
A pie graph consists of slices that are defined using the PieSlice type. The slices can have any values as the PieSeries type calculates the percentage of a slice compared with the sum of all slices in the series to determine the actual size of the slice in the graph.
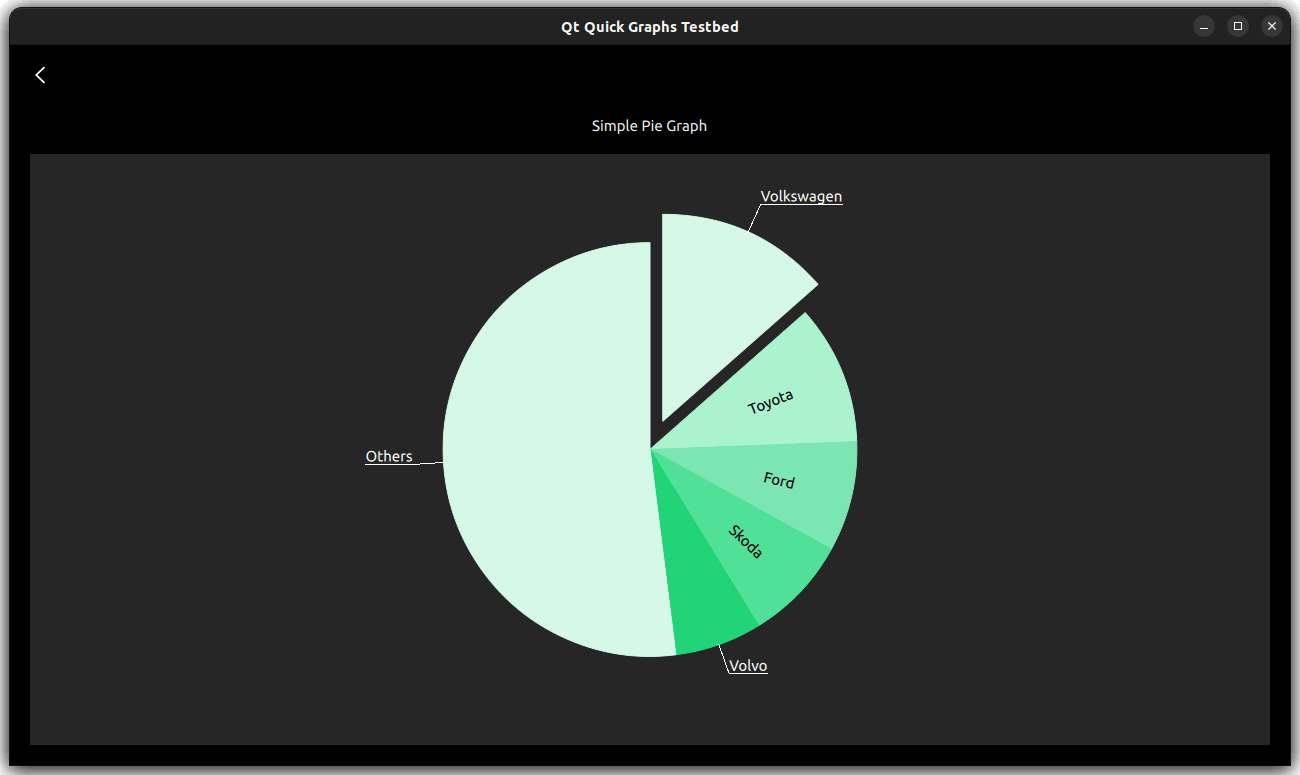
见 PieSeries and PieSlice 了解更多信息。
The scatter data is displayed as a collection of points on the graph. For each point, two values are specified that determine its position on the horizontal axis and the vertical axis.
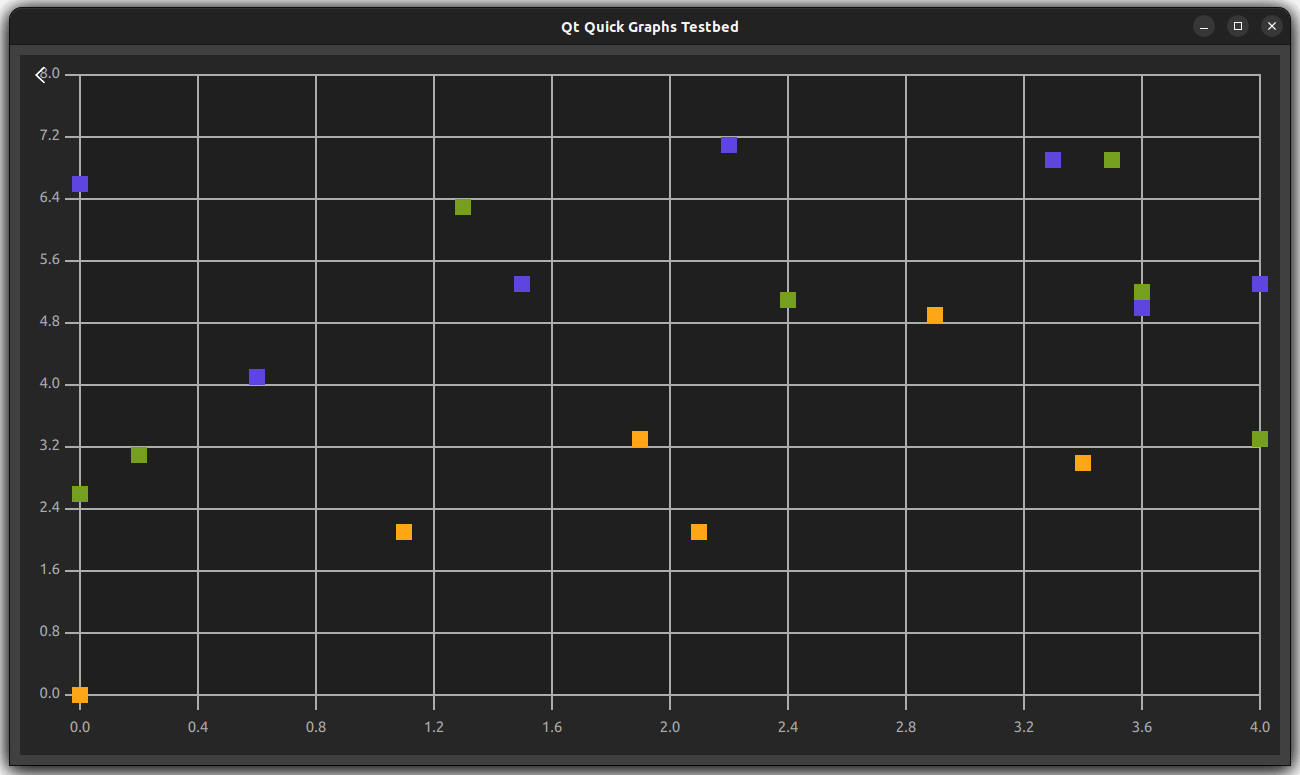
见 ScatterSeries and XYPoint 了解更多信息。
A spline graph is used to show information as a series of data points connected by smooth spline segments that moves through all the points defined in the graph.
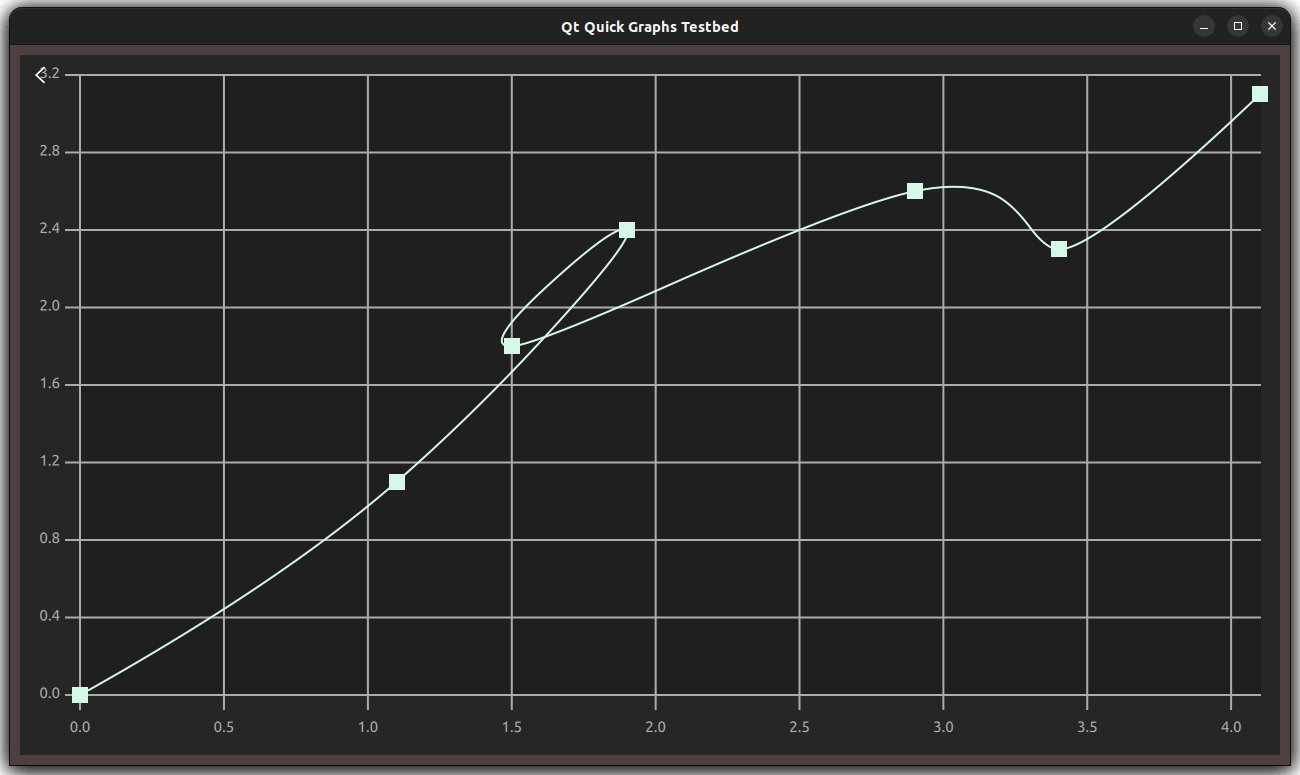
见 SplineSeries and XYPoint 了解更多信息。