The ScatterSeries type presents data in scatter graphs. 更多...
| import 语句: |
import QtGraphs
|
| 在 C++: | QScatterSeries |
| 继承: |
The scatter data is displayed as a collection of points on the graph. For each point, two values are specified that determine its position on the horizontal axis and the vertical axis.
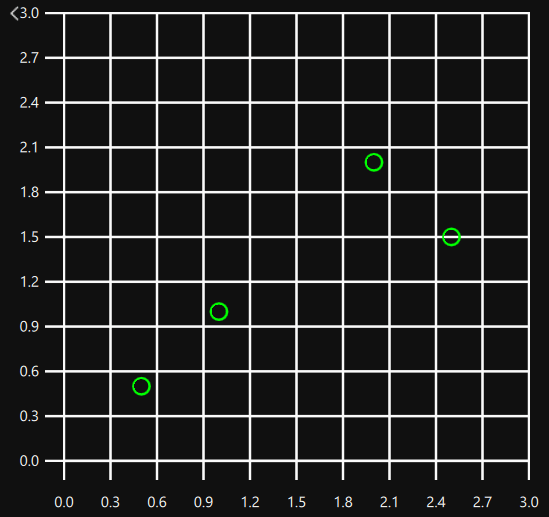
You can represent scatter data by creating a ScatterSeries inside GraphsView . The data can be added to the graph by creating XYPoints as children for the ScatterSeries that define the x and y values of each point.
GraphsView {
    anchors.fill: parent
    axisX: ValueAxis {
        max: 3
    }
    axisY: ValueAxis {
        max: 3
    }
    ScatterSeries {
        color: "#00ff00"
        XYPoint { x: 0.5; y: 0.5 }
        XYPoint { x: 1; y: 1 }
        XYPoint { x: 2; y: 2 }
        XYPoint { x: 2.5; y: 1.5 }
    }
}
Multiple scatter graphs can be created by adding multiple ScatterSeries as children of GraphsView . In such cases only one series should define the axis used as multiple definitions only override the earlier ones.
GraphsView {
    anchors.fill: parent
    ScatterSeries {
        color: "#00ff00"
        axisX: ValueAxis {
            max: 3
        }
        axisY: ValueAxis {
            max: 3
        }
        XYPoint { x: 0.5; y: 0.5 }
        XYPoint { x: 1; y: 1 }
        XYPoint { x: 2; y: 2 }
        XYPoint { x: 2.5; y: 1.5 }
    }
    ScatterSeries {
        color: "#ff0000"
        XYPoint { x: 0.5; y: 3 }
        XYPoint { x: 1; y: 2 }
        XYPoint { x: 2; y: 2.5 }
        XYPoint { x: 2.5; y: 1 }
    }
}
|
pointDelegate : Component |
Marks points with the given QML component.
pointDelegate: Image {
    source: "images/happy_box.png"
}