An application that demonstrates the Qt Charts Widgets API.
This example demonstrates the Qt Charts API for widgets by using included sample data to populate a number of chart types and interactions for a user.
| Shows how to use a selection feature for the bar chart. | |
| Shows how to combine different charts and set the axes. | |
| Shows how to create a simple area chart. | |
| BarChart shows the data in sets as separate bars within categories. | |
| Shows how to create a box-and-whiskers chart. | |
| 展示如何創建燭颱圖錶。 | |
| Shows the look and feel of the different built-in themes. | |
| Shows how to create a horizontal bar chart. | |
| Shows how to create a simple horizontal percent bar chart. | |
| Shows how to create a simple stacked horizontal bar chart. | |
| Shows how to create a simple line chart. | |
| Shows how to create a nested donut chart using the QPieSeries API. | |
| Shows how to create a simple percent bar chart. | |
| Shows how to create a simple polar chart with multiple different series. | |
| The example shows how to create a simple scatter chart. | |
| Shows how to create a simple stacked bar chart. | |
| Shows how to create a donut breakdown chart. | |
| Shows how to customize the appearance of chart elements. | |
| Shows how to detach the legend from the chart and attach it back. | |
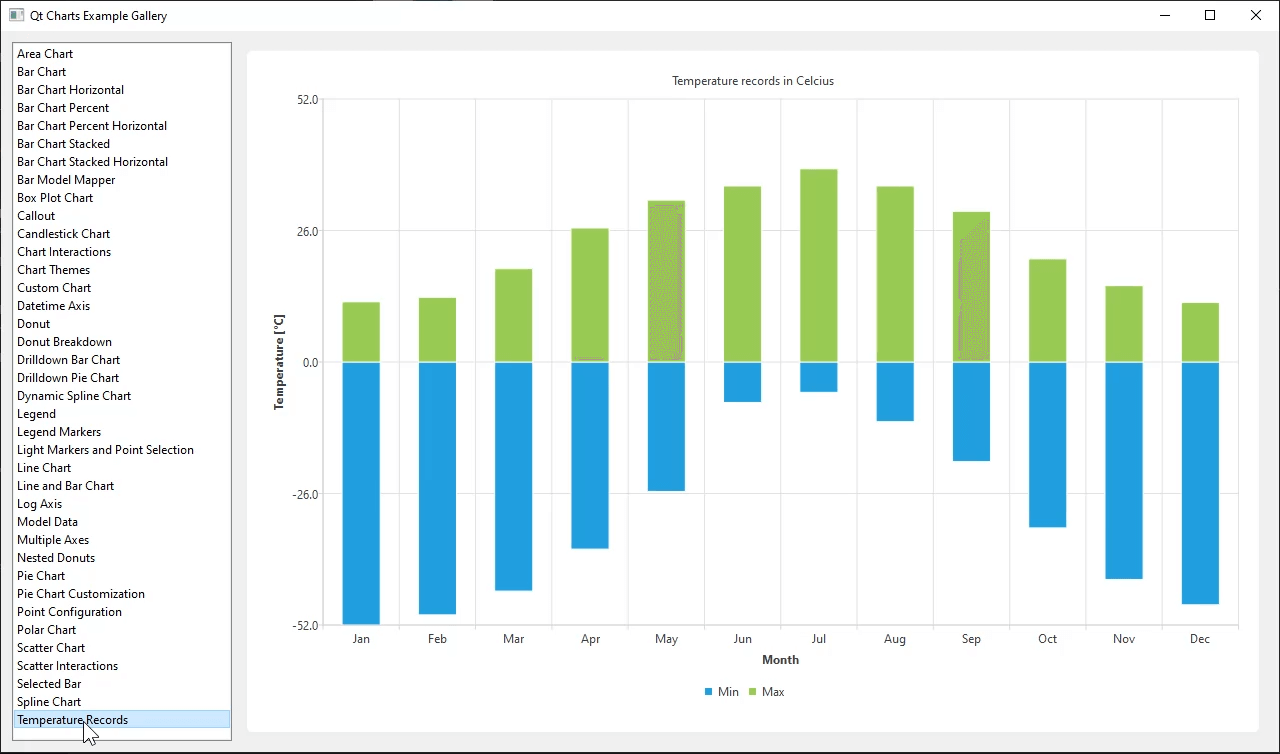
| Shows how to create a bar chart with negative bars. | |
| Shows how to draw an additional element (a callout) on top of a chart. | |
| Shows how to implement drilldown using a stacked barchart. | |
| Shows how to use QLineChart with QDateTimeAxis. | |
| Shows how to modify the configuration of individual points. | |
| Shows how to use QAbstractItemModel derived model as the data for a bar series. | |
| Shows how to make use of legend markers. | |
| Shows how to use light markers and points selection for a series. | |
| Shows how to use QLogValueAxis. | |
| Shows how to use the QAbstractItemModel derived model as series data. | |
| Shows how to create a chart with a vertical axis for each series. |
要運行範例從 Qt Creator ,打開 歡迎 模式,然後選擇範例從 範例 。更多信息,見 Qt Creator:教程:構建並運行 .
If you want to implement charts with QML see the Charts with QML Gallery .