The Qt Charts module provides a set of easy-to-use chart components. It uses the Qt Graphics View Framework to integrate charts with modern user interfaces. Qt Charts can be used as QWidgets, QGraphicsWidget ,或 QML 類型。用戶可以選擇某種主題,輕鬆創建令人印象深刻的圖錶。
注意: The Qt Charts module is in the maintenance phase. For new projects, consider using the Qt Graphs module. To render 2D charts, QtGraphs 使用 Qt Quick 形狀 , which is a more modern GUI technology compared to the outdated Qt Graphics View Framework used by the Qt Charts module.
Qt Charts QML API 是在 QML 應用程序中,直觀且簡單展示圖錶的手段。
此範例展示如何創建簡單綫圖錶:
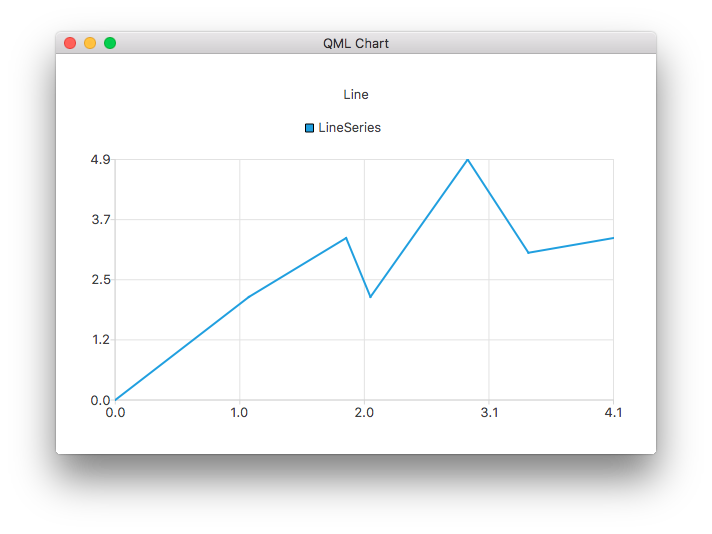
ChartView {
    title: "Line Chart"
    anchors.fill: parent
    antialiasing: true
    LineSeries {
        name: "Line"
        XYPoint { x: 0; y: 0 }
        XYPoint { x: 1.1; y: 2.1 }
        XYPoint { x: 1.9; y: 3.3 }
        XYPoint { x: 2.1; y: 2.1 }
        XYPoint { x: 2.9; y: 4.9 }
        XYPoint { x: 3.4; y: 3.0 }
        XYPoint { x: 4.1; y: 3.3 }
    }
}
模塊的 QML 類型是可用的透過
QtCharts
導入。要使用類型,添加以下 import 語句到 .qml 文件:
import QtCharts
注意: 實例化的 QApplication is required for the QML types as the module depends on Qt's 圖形視圖框架 為渲染。 QGuiApplication is not sufficient. However, projects created with Qt Creator's Qt Quick Application wizard are based on the Qt Quick template that uses QGuiApplication by default. All the QGuiApplication instances in such projects must be replaced with QApplication .
使用 Qt 模塊的 C++ API 要求直接 (或透過其它依賴) 鏈接到模塊庫。幾個構建工具對此有專用支持,包括 CMake and qmake .
使用
find_package()
命令定位所需模塊組件在
Qt6
包:
find_package(Qt6 REQUIRED COMPONENTS Charts)
target_link_libraries(mytarget PRIVATE Qt6::Charts)
更多細節,見 構建采用 CMake 概述。
要配置采用 qmake 構建模塊,添加模塊作為值為
QT
變量在工程的 .pro 文件:
QT += charts
Qt Charts 的變化 列齣瞭 Qt 的 Qt 6 係列在模塊 API 和功能上所做齣的重要改變。
Qt Charts 在商業許可下是可用的來自 Qt 公司 。此外,它是可用的根據 GNU GPL (一般公共許可) 第 3 版 。見 Qt 許可 進一步瞭解細節。