Example application imitating an airplane cockpit using Graphs.
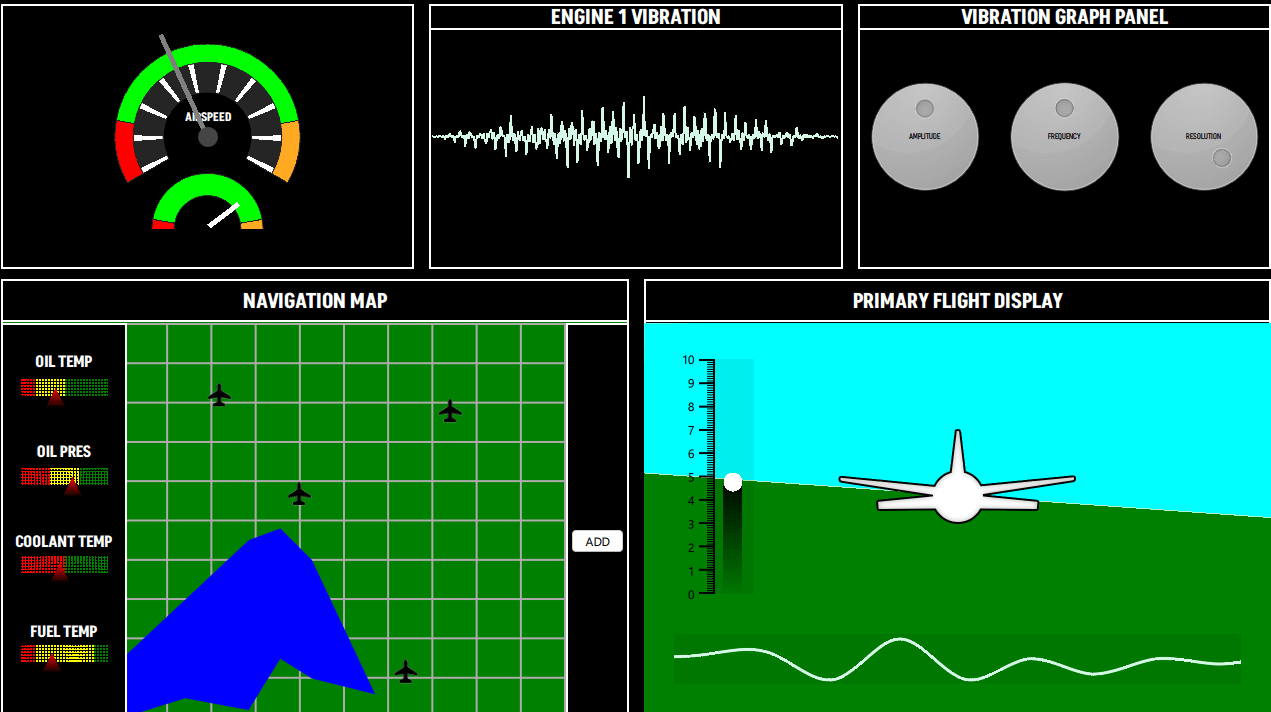
The cockpit example features a number of different graph types to draw fictional airplane control screens. The graphs used in the example are:
要运行范例从 Qt Creator ,打开 欢迎 模式,然后选择范例从 范例 。更多信息,见 Qt Creator:教程:构建并运行 .
The speedometer view consists of 3 PieSeries inside a single GraphsView with QML Rectangles as needles for both of the dials.
The
backgroundVisible
property for the
GraphsTheme
被设为
false
. All the
PieSlices
have their own custom colors. To display a circle scale with a hollow center, the example uses
PieSeries
采用不同
holeSize
.
GraphsView {
    id: chart
    anchors.fill: parent
    anchors.margins: 20
    theme: GraphsTheme {
        backgroundVisible: false
        borderColors: ["#252525"]
    }
    PieSeries {
        id: pieOuter
        pieSize: 1
        holeSize: 0.8
        startAngle: -120
        endAngle: 120
        PieSlice { label: "Stall"; value: 1; color: "#ff0000"; labelVisible: false }
        PieSlice { label: "Optimal"; value: 4; color: "#00ff00"; labelVisible: false }
        PieSlice { label: "Overspeed"; value: 1; color: "#ffaa22"; labelVisible: false }
    }
    PieSeries {
        pieSize: 0.8
        holeSize: 0.6
        startAngle: -120
        endAngle: 120
        PieSlice { value: 1; color: "#ffffff"; }
        PieSlice { value: 4; color: "#252525"; }
        PieSlice { value: 1; color: "#ffffff"; }
        PieSlice { value: 4; color: "#252525"; }
        PieSlice { value: 1; color: "#ffffff"; }
        PieSlice { value: 4; color: "#252525"; }
        PieSlice { value: 1; color: "#ffffff"; }
        PieSlice { value: 4; color: "#252525"; }
        PieSlice { value: 1; color: "#ffffff"; }
        PieSlice { value: 4; color: "#252525"; }
        PieSlice { value: 1; color: "#ffffff"; }
        PieSlice { value: 4; color: "#252525"; }
        PieSlice { value: 1; color: "#ffffff"; }
        PieSlice { value: 4; color: "#252525"; }
        PieSlice { value: 1; color: "#ffffff"; }
        PieSlice { value: 4; color: "#252525"; }
        PieSlice { value: 1; color: "#ffffff"; }
        PieSlice { value: 4; color: "#252525"; }
        PieSlice { value: 1; color: "#ffffff"; }
    }
    PieSeries {
        pieSize: 0.6
        holeSize: 1.0
        startAngle: -120
        endAngle: 120
        verticalPosition: 1
        PieSlice { label: "Stall"; value: 1; color: "#ff0000"; labelVisible: false }
        PieSlice { label: "Optimal"; value: 4; color: "#00ff00"; labelVisible: false  }
        PieSlice { label: "Overspeed"; value: 1; color: "#ffaa22"; labelVisible: false  }
    }
}
The Vibration Panel contains a LineSeries which is dynamically updated at runtime. After launch, a set of points is added to the series using the QML invoked append function. Then on each frame, the values are replaced using the replace function with calculated values. Users can change these values through the Vibration Graph Panel.
LineSeries {
    id: line
    property int divisions: 500
    property real amplitude: 0.5
    property real resolution: 0.5
    FrameAnimation {
        running: true
        onTriggered: {
            for (let i = 0; i < line.divisions; ++i) {
                let y = Math.sin(line.resolution*i)
                y *= Math.cos(i)
                y *= Math.sin(i / line.divisions * 3.2) * 3 * line.amplitude * Math.random()
               line.replace(i, (i/line.divisions) * 8.0, y + 4)
            }
        }
    }
    Component.onCompleted: {
        for (let i = 1; i <= divisions; ++i) {
            append((i/divisions) * 8.0, 4.0)
        }
    }
    function change(newDivs) {
        let delta = newDivs - divisions
        if (delta < 0) {
            delta = Math.abs(delta)
            removeMultiple(count - 1 - delta, delta)
        } else {
            for (let i = 0; i < delta; ++i) {
                append(((count + i)/divisions) * 8.0, 4.0)
            }
        }
        divisions = newDivs
    }
}
This panel contains control knobs to adjust values that affect the visualization displayed in the Vibration Panel.
The Navigation Map has two main sections:
BarSeries {
    property real barOpacity: 0.
    id: barSeries
    barsType: BarSeries.BarsType.Stacked
    barWidth: 0.2
    barDelegate: Item {
        id: delegate
        antialiasing: true
        property real barOpacity: 0.5
        property color barColor
        property string barLabel
        FrameAnimation {
            running: true
            onTriggered: {
                delegate.barOpacity = Math.abs(Math.sin(elapsedTime))
            }
        }
        ShaderEffect {
            id: effect
            readonly property alias iTime: delegate.barOpacity
            readonly property alias iColor: delegate.barColor
            readonly property vector3d iResolution: Qt.vector3d(width, height, 1.0)
            blending: true
            fragmentShader: 'bar.frag.qsb'
            anchors.fill: parent
        }
    }
    BarSet { id: set1; label: "Low"; values: [1, 2, 3, 1]; color: "red" }
    BarSet { id: set2; label: "Medium"; values: [2, 2, 0, 4]; color: "yellow"}
    BarSet { id: set3; label: "High"; values: [3, 2, 3, 1]; color: "green"}
}
AreaSeries {
    property double x: 0
    property double y: 0
    id: lake1
    color: "blue"
    upperSeries: LineSeries {
        id: s1
        XYPoint { x: 0.0; y: -3.5 }
        XYPoint { x: 1.0; y: -5.0 }
        XYPoint { x: 2.0; y: -2.5 }
        XYPoint { x: 2.5; y: -4.0 }
        XYPoint { x: 3.0; y: -4.2 }
    }
    lowerSeries: LineSeries {
        id: s2
        XYPoint { x: 0.0; y: -7.2 }
        XYPoint { x: 1.0; y: -7.0 }
        XYPoint { x: 2.0; y: -8.5 }
        XYPoint { x: 2.5; y: -8.0 }
        XYPoint { x: 3.0; y: -9.0 }
        XYPoint { x: 4.0; y: -6.5 }
    }
}
AreaSeries {
    property double x: 0
    property double y: 0
    id: lake2
    color: "blue"
    upperSeries: LineSeries {
        id: s3
        XYPoint { x: 0.0; y: 1.5 }
        XYPoint { x: 1.0; y: 3.0 }
        XYPoint { x: 2.0; y: 4.5 }
        XYPoint { x: 2.5; y: 4.8 }
        XYPoint { x: 3.0; y: 4.0 }
    }
    lowerSeries: LineSeries {
        id: s4
        XYPoint { x: 0.0; y: 0.0 }
        XYPoint { x: 1.0; y: 0.5 }
        XYPoint { x: 2.0; y: 0.2 }
        XYPoint { x: 2.5; y: 1.5 }
        XYPoint { x: 3.0; y: 1.0 }
        XYPoint { x: 4.0; y: 0.6 }
    }
}
// POI
ScatterSeries {
    name: "Airport"
    pointDelegate: Image {
            source: "airplane-ico.png"
            mipmap: true
            width: 30
            height: 30
    }
    XYPoint{x: 4.0; y: 5.7}
    XYPoint{x: 2.2; y: 8.2}
    XYPoint{x: 6.4; y: 1.2}
    XYPoint{x: 7.4; y: 7.8}
}
LineSeries {
    id: linePath
    selectable: true
    draggable: true
    color: "white"
    pointDelegate: Item {
        width: 50
        height: 50
        property real pointValueX
        property real pointValueY
        FrameAnimation {
            id: scatterAnim
            running: true
        }
        ShaderEffect {
            readonly property vector3d iResolution: Qt.vector3d(width, height, 1.0)
            readonly property alias iTime: scatterAnim.elapsedTime
            blending: true
            fragmentShader: 'circleMarker.frag.qsb'
            anchors.fill: parent
        }
        Text {
            color: "white"
            font.pointSize: 4
            text: "LAT: " + pointValueX.toFixed(1) + ", " + "LON: " + pointValueY.toFixed(1)
        }
    }
}
The Primary Flight Display features an imitation of the "3D" view of the terrain. It is implemented with two AreaSeries to represent the ground and the sky each with custom colors. A FrameAnimation updates the values of these series.
AreaSeries {
    id: upperArea
    color: "cyan"
    upperSeries: LineSeries {
        XYPoint {x: 0; y: 10}
        XYPoint {x: 10; y: 10}
    }
    lowerSeries: LineSeries {
        id: upperLine
        XYPoint {x: 0; y: 3}
        XYPoint {x: 10; y: 4}
    }
}
FrameAnimation {
    running: true
    onTriggered: {
        upperLine.replace(0, upperLine.at(0).x, Math.sin(elapsedTime) + 6)
        upperLine.replace(1, upperLine.at(1).x, Math.cos(elapsedTime) + 6)
        lowerLine.replace(0, lowerLine.at(0).x, Math.sin(elapsedTime) + 6)
        lowerLine.replace(1, lowerLine.at(1).x, Math.cos(elapsedTime) + 6)
        barSet.values = [Math.sin(elapsedTime) + 5]
    }
}
At the left side, a themed BarSeries shows the y-axis labels. This BarSeries also uses a custom shader for the bar.
BarSeries {
    id: barSeries
    selectable: true
    barDelegate: Item {
        id: delegate
        antialiasing: true
        property real barOpacity: 0.5
        property color barColor
        property string barLabel
        ShaderEffect {
            id: effect
            readonly property vector3d iResolution: Qt.vector3d(width, height, 1.0)
            blending: true
            fragmentShader: 'pitchbar.frag.qsb'
            anchors.fill: parent
        }
    }
    BarSet { id: barSet; values: []; selectedColor: "red" }
}
At the bottom of the view, a SplineSeries visualizes the terrain height under the plane. The SplineSeries is updated at each frame. The code that updates the series appends to the back and removes them from the front a continuous series of points. On hover, the SplineSeries shows a tooltip which displays the y-axis value (Altitude).
GraphsView {
    anchors.fill: parent
    anchors.leftMargin: -90
    anchors.rightMargin: -80
    anchors.bottomMargin: -30
    theme: GraphsTheme {
        backgroundVisible: false
        plotAreaBackgroundColor: "#11000000"
    }
    axisX: ValueAxis {
        max: 10
        subTickCount: 9
        lineVisible: false
        gridVisible: false
        subGridVisible: false
        labelsVisible: false
        visible: false
    }
    axisY: ValueAxis {
        max: 10
        subTickCount: 9
        lineVisible: false
        gridVisible: false
        subGridVisible: false
        labelsVisible: false
        visible: false
    }
    ToolTip {
        id: tooltip
    }
    onHoverEnter: {
        tooltip.visible = true;
    }
    onHoverExit: {
        tooltip.visible = false;
    }
    onHover: (seriesName, position, value) => {
                 tooltip.x = position.x + 1;
                 tooltip.y = position.y + 1;
                 tooltip.text = "Altitude: " + (value.y * 1000).toFixed(1) + "m";
             }
    FrameAnimation {
        property var points: []
        Component.onCompleted: {
            for (let i = 0; i < altitudeLine.count; ++i) {
                points[i] = altitudeLine.at(i)
            }
        }
        running: true
        onTriggered: {
            for (let i = 0; i < points.length; ++i) {
                points[i].x -= frameTime
                if (points[1].x <= -2) {
                    let p = points[0]
                    p.x = points[points.length - 1].x + 1
                    altitudeLine.append(p)
                    altitudeLine.remove(0)
                    points.length = 0
                    for (let i = 0; i < altitudeLine.count; ++i) {
                        points[i] = altitudeLine.at(i)
                    }
                }
            }
            altitudeLine.replace(points)
            altitudeLine.update()
        }
    }
    SplineSeries {
        id: altitudeLine
        hoverable: true
        width: 3
        XYPoint {x: 0; y: 5}
        XYPoint {x: 1; y: 2}
        XYPoint {x: 2; y: 5}
        XYPoint {x: 3; y: 4}
        XYPoint {x: 4; y: 6}
        XYPoint {x: 5; y: 7}
        XYPoint {x: 6; y: 9}
        XYPoint {x: 7; y: 8}
        XYPoint {x: 8; y: 9}
        XYPoint {x: 9; y: 6}
        XYPoint {x: 10; y: 6}
        XYPoint {x: 11; y: 6}
        XYPoint {x: 12; y: 1}
        XYPoint {x: 13; y: 9}
        XYPoint {x: 14; y: 1}
    }
}