Presents data in line graphs. 更多...
| import 语句: | import QtGraphs |
| 实例化: | QLineSeries |
| 继承: | |
| 状态: | 技术预览 |
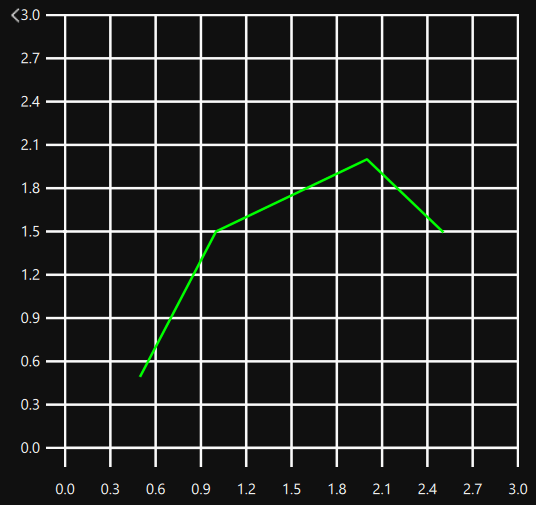
A line graph is used to show information as a series of data points connected by straight lines.
LineSeries uses mostly the same API as ScatterSeries so see ScatterSeries documentation for further usage examples.
另请参阅 ScatterSeries .
|
capStyle : Qt::PenCapStyle |
控制线的帽盖样式。设为之一对于 Qt.FlatCap , Qt.SquareCap or Qt.RoundCap . By default the cap style is Qt.SquareCap. Invalid values are automatically set to the default value.
另请参阅 Qt::PenCapStyle .
|
pointMarker : Component |
Marks the point with the given QML component.
pointMarker: Image {
    source: "images/happy_box.png"
}
|
width : real |
The width of the line. By default, the width is 2.0. Widths lower than 0 are invalid and are automatically set to 0.