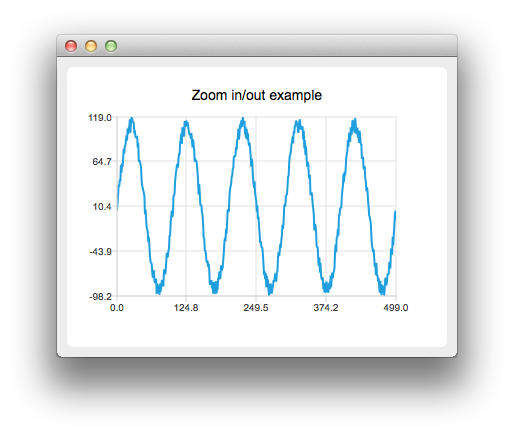
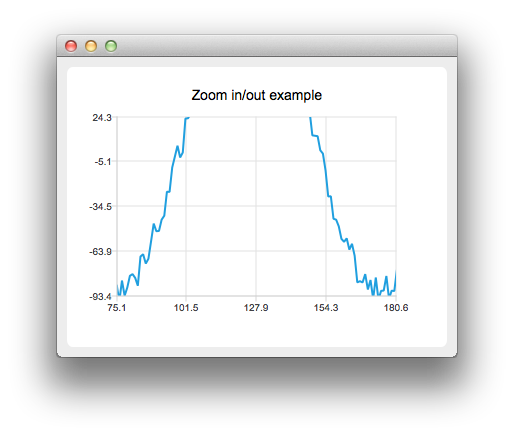
范例展示如何创建自己的自定义缩放效果。
范例展示如何创建自己的自定义缩放效果采用 QRubberBand 通过使用鼠标及如何使用触摸手势进行平移和缩放。


要运行范例从 Qt Creator ,打开 欢迎 模式,然后选择范例从 范例 。更多信息,拜访 构建和运行范例 .
让我们首先采用一些范例数据创建线系列。
    auto series = new QLineSeries;
    for (int i = 0; i < 500; i++) {
        QPointF p((qreal) i, qSin(M_PI / 50 * i) * 100);
        p.ry() += QRandomGenerator::global()->bounded(20);
        *series << p;
    }
Then we create a custom chart view by deriving from QChartView :
class ChartView : public QChartView
We override mouse and key event handling
protected:
    bool viewportEvent(QEvent *event);
    void mousePressEvent(QMouseEvent *event);
    void mouseMoveEvent(QMouseEvent *event);
    void mouseReleaseEvent(QMouseEvent *event);
    void keyPressEvent(QKeyEvent *event);
Then we implement a custom logic for mouse and key events. For example pressing the '+' key will zoom in and pressing the '-' key will zoom out.
void ChartView::keyPressEvent(QKeyEvent *event)
{
    switch (event->key()) {
    case Qt::Key_Plus:
        chart()->zoomIn();
        break;
    case Qt::Key_Minus:
        chart()->zoomOut();
        break;
We also create our own QChart :
class Chart : public QChart
Where we can handle the gestures:
bool Chart::sceneEvent(QEvent *event)
{
    if (event->type() == QEvent::Gesture)
        return gestureEvent(static_cast<QGestureEvent *>(event));
    return QChart::event(event);
}
bool Chart::gestureEvent(QGestureEvent *event)
{
    if (QGesture *gesture = event->gesture(Qt::PanGesture)) {
        auto pan = static_cast<QPanGesture *>(gesture);
        QChart::scroll(-(pan->delta().x()), pan->delta().y());
    }
    if (QGesture *gesture = event->gesture(Qt::PinchGesture)) {
        auto pinch = static_cast<QPinchGesture *>(gesture);
        if (pinch->changeFlags() & QPinchGesture::ScaleFactorChanged)
            QChart::zoom(pinch->scaleFactor());
    }
    return true;
}
Note that you will need to call grabGesture() to both QMainWindow and QChart .