Qt Charts QML API 是在 QML 应用程序中,直观且简单展示图表的手段。
使用以下 QML 创建简单饼状图表:
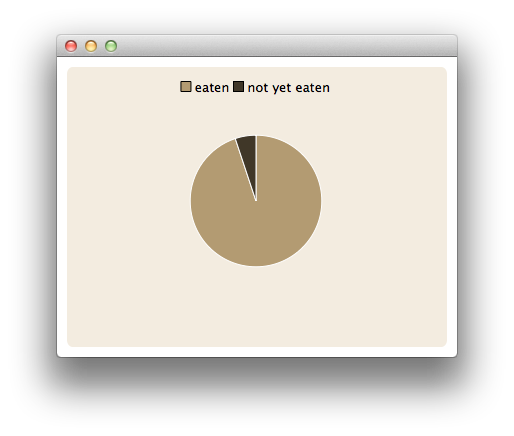
import QtQuick 2.0
import QtCharts 2.0
ChartView {
    width: 400
    height: 300
    theme: ChartView.ChartThemeBrownSand
    antialiasing: true
    PieSeries {
        id: pieSeries
        PieSlice { label: "eaten"; value: 94.9 }
        PieSlice { label: "not yet eaten"; value: 5.1 }
    }
}
注意: 从 Qt Creator 3.0 起,采用基于 Qt Quick 2 模板的 Qt Quick 应用程序向导创建的工程使用 QGuiApplication 在默认情况下。由于 Qt Charts 利用 Qt 图形视图框架为绘制, QApplication 必须使用。采用向导创建的工程可用于 Qt Charts 后于 QGuiApplication 被替换采用 QApplication .
| AbstractAxis | 用于专用轴类型的基本类型 |
| AbstractBarSeries | 用于所有条形系列类型的抽象父级类型 |
| AbstractSeries | 用于所有 Qt Chart 系列类型的基类型 |
| AreaSeries | 在区域图表中呈现数据 |
| BarCategoryAxis | 将类别添加到图表轴 |
| BarSeries | 将一系列数据按类别分组呈现为垂直条形 |
| BarSet | 表示条形图表中的一组条形 |
| BoxPlotSeries | Presents data in box-and-whiskers charts |
| BoxSet | Represents one item in a box-and-whiskers chart |
| CandlestickSeries | Represents a series of data as candlesticks |
| CandlestickSet | Represents a single candlestick item in a candlestick chart |
| CategoryAxis | Places named ranges on the axis |
| CategoryRange | Defines a range on a category axis |
| ChartView | 管理图表的系列、图例和轴的图形表示 |
| DateTimeAxis | Adds dates and times to a chart's axis |
| HBarModelMapper | Horizontal model mapper for bar series |
| HBoxPlotModelMapper | Horizontal model mapper for box plot series |
| HCandlestickModelMapper | Horizontal model mapper for a candlestick series |
| HPieModelMapper | Horizontal model mapper for pie series |
| HXYModelMapper | A horizontal model mapper for XYSeries |
| HorizontalBarSeries | Presents a series of data as horizontal bars grouped by category |
| HorizontalPercentBarSeries | Presents a series of categorized data as a percentage of each category |
| HorizontalStackedBarSeries | Presents a series of data as stacked horizontal bars, with one bar per category |
| 图例 | 显示图表的图例 |
| LineSeries | 以线图表形式呈现数据 |
| LogValueAxis | Adds a logarithmic scale to a chart's axis |
| Margins | Defines margins between the edge of the chart rectangle and the plot area |
| PercentBarSeries | Presents a series of categorized data as a percentage of each category |
| PieSeries | Presents data in pie charts |
| PieSlice | Represents a single slice in a pie series |
| PolarChartView | Presents data in polar charts |
| ScatterSeries | Type presents data in scatter charts |
| SplineSeries | 以样条线图表形式呈现数据 |
| StackedBarSeries | Presents a series of data as vertically stacked bars, with one bar per category |
| VBarModelMapper | Vertical model mapper for bar series |
| VBoxPlotModelMapper | Vertical model mapper for box plot series |
| VCandlestickModelMapper | Vertical model mapper for a candlestick series |
| VPieModelMapper | Vertical model mapper for pie series |
| VXYModelMapper | A vertical model mapper for XYSeries |
| ValueAxis | 将值添加到图表轴 |
| XYPoint | Initializes XY-series coordinate data |
| XYSeries | A base type for line, spline, and scatter series |