How to visualize data from a CSV file in Qt Graphs.
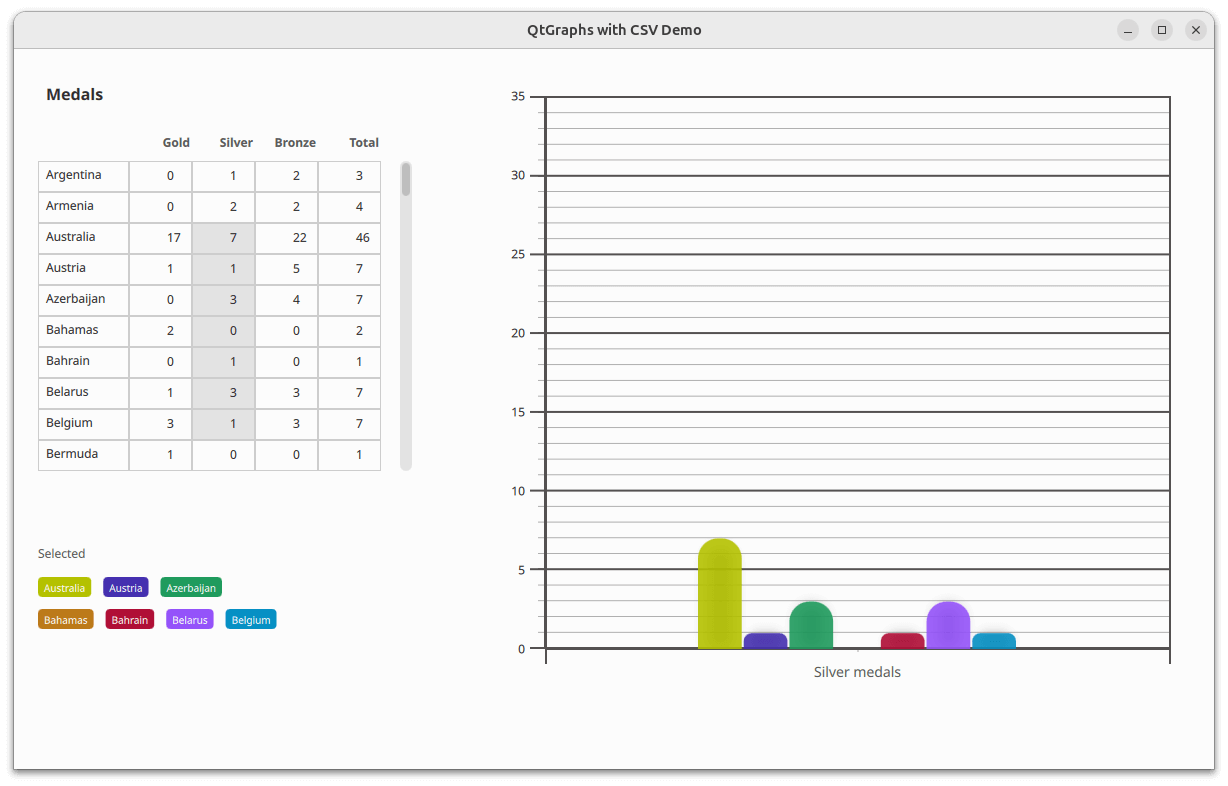
The Graphs with CSV Data example shows how to display data from a CSV file in a 2D bar chart. The application reads the CSV file using a third-party CSV parser. The data is inserted into a custom model that inherits from the QAbstractTableModel . After the data is inserted into the model, the leftmost column contains the vertical header data, while the top row contains the horizontal header data.
The selected third-party library knows nothing about
Qt 資源係統
, so it cannot load the CSV file from the file path. Therefore, the source's contents must be loaded before passing it to the library. The CSV library in this example accepts the file as either file path,
std::fstream
,或
std::stringstream
. Since the CSV file is in Qt resources, the library doesn't know how to load it, and
QFile
doesn't support
std::fstream
; the only option left is to use
std::stringstream
. The whole file can be read into a string via
QFile::readAll
(), and then that string is opened into a
std::stringstream
.
In the application window, a table view presents the data from the model. From the table view, a user can select a subsection of data that is then displayed in the bar graph.
As the bar series doesn't modify category axis labels, updating the series doesn't update the axis labels. That is handled in JavaScript by extracting label names from the model's leftmost column. The extracted label names are then set to the category axis's labels property.
    function extractBarSetGategories(first, count) {
        var categories = [];
        const last = first + count;
        for (var i = first; i < last; ++i)
            categories.push(tv.model.headerData(i, Qt.Horizontal, Qt.DisplayRole) + " medals");
        return categories;
    }
要運行範例從 Qt Creator ,打開 歡迎 模式,然後選擇範例從 範例 。更多信息,見 Qt Creator:教程:構建並運行 .
另請參閱 QML 應用程序 .