注意: This is part of the Charts with Widgets Gallery 範例。
要創建綫圖錶, QLineSeries 實例是需要的。讓我們創建一個。
auto series = new QLineSeries;
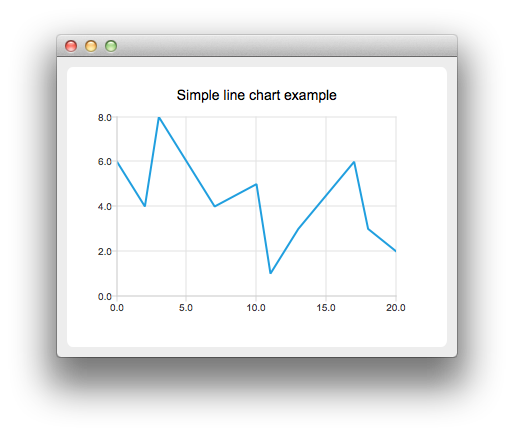
Then we add data to the series. We can use the append() member function or use the stream operator.
series->append(0, 6);
series->append(2, 4);
series->append(3, 8);
series->append(7, 4);
series->append(10, 5);
*series << QPointF(11, 1) << QPointF(13, 3) << QPointF(17, 6) << QPointF(18, 3) << QPointF(20, 2);
To present the data on the chart we need a QChart instance. We add the series to it, create the default axes, and set the title of the chart.
auto chart = new QChart;
chart->legend()->hide();
chart->addSeries(series);
chart->createDefaultAxes();
chart->setTitle("Simple Line Chart");
Then we create a QChartView 對象采用 QChart as a parameter. This way we don't need to create a QGraphicsView scene ourselves.
createDefaultChartView(chart);
圖錶展示就緒。