注意: This is part of the Charts with QML Gallery 范例。
Let's define an empty ChartView first:
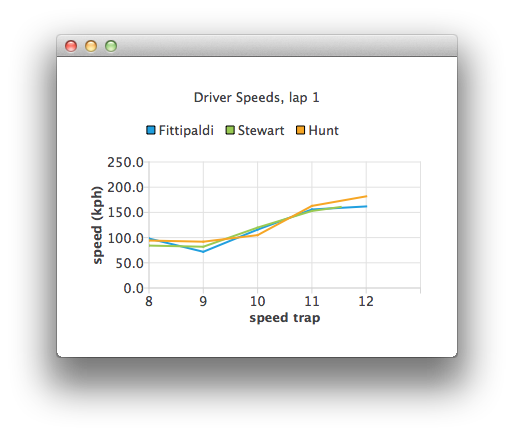
ChartView {
    id: chartView
    title: "Driver Speeds, lap 1"
    anchors.fill: parent
    legend.alignment: Qt.AlignTop
    animationOptions: ChartView.SeriesAnimations
    antialiasing: true
}
Our ListModel uses hard-coded test data. In a real application the data source would be a timing system.
ListModel {
    // Hard-coded test data
    ListElement { speedTrap:0; driver: "Fittipaldi"; speed:104.12 }
    ListElement { speedTrap:0; driver:"Stewart"; speed:106.12 }
    ListElement { speedTrap:0; driver:"Hunt"; speed:106.12 }
    ...
// An example ListModel containing F1 legend drivers' speeds at speed traps
SpeedsList {
    id: speedsList
    Component.onCompleted: {
        timer.start();
    }
}
The data is parsed with a timer. The line series representing each driver are created on the fly.
// A timer to mimic refreshing the data dynamically
Timer {
    id: timer
    interval: 700
    repeat: true
    triggeredOnStart: true
    running: false
    onTriggered: {
        root.currentIndex++;
        if (root.currentIndex < speedsList.count) {
            // Check if there is a series for the data already
            // (we are using driver name to identify series)
            var lineSeries = chartView.series(speedsList.get(root.currentIndex).driver);
            if (!lineSeries) {
                lineSeries = chartView.createSeries(ChartView.SeriesTypeLine,
                                                    speedsList.get(root.currentIndex).driver);
                chartView.axisY().min = 0;
                chartView.axisY().max = 250;
                chartView.axisY().tickCount = 6;
                chartView.axisY().titleText = "speed (kph)";
                chartView.axisX().titleText = "speed trap";
                chartView.axisX().labelFormat = "%.0f";
            }
            lineSeries.append(speedsList.get(root.currentIndex).speedTrap,
                              speedsList.get(root.currentIndex).speed);
            if (speedsList.get(root.currentIndex).speedTrap > 3) {
                chartView.axisX().max = Number(speedsList.get(root.currentIndex).speedTrap) + 1;
                chartView.axisX().min = chartView.axisX().max - 5;
            } else {
                chartView.axisX().max = 5;
                chartView.axisX().min = 0;
            }
            chartView.axisX().tickCount = chartView.axisX().max - chartView.axisX().min + 1;
        } else {
            // No more data, change x-axis range to show all the data
            timer.stop();
            chartView.animationOptions = ChartView.AllAnimations;
            chartView.axisX().min = 0;
            chartView.axisX().max = speedsList.get(root.currentIndex - 1).speedTrap;
        }
    }
}